Business, Education & Technology Isom
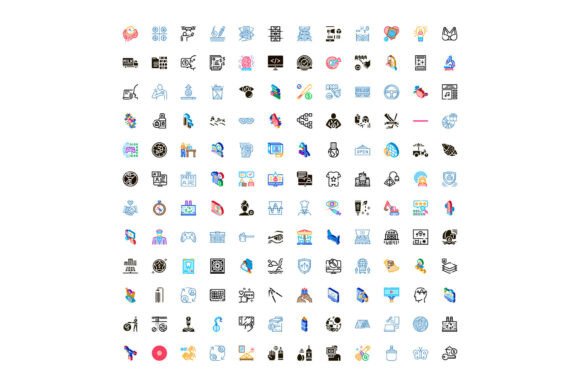
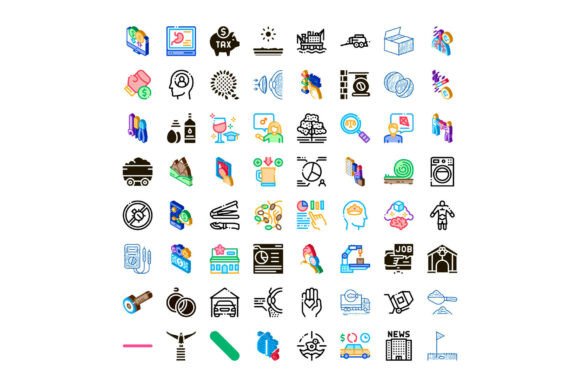
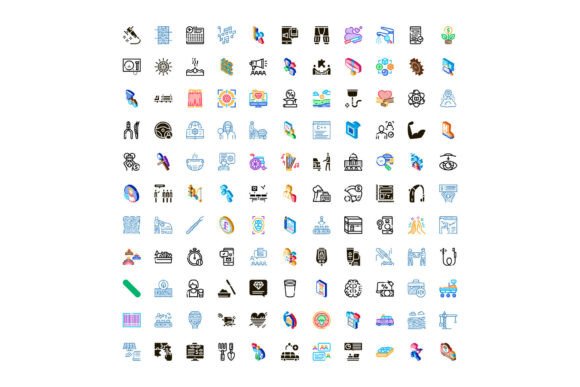
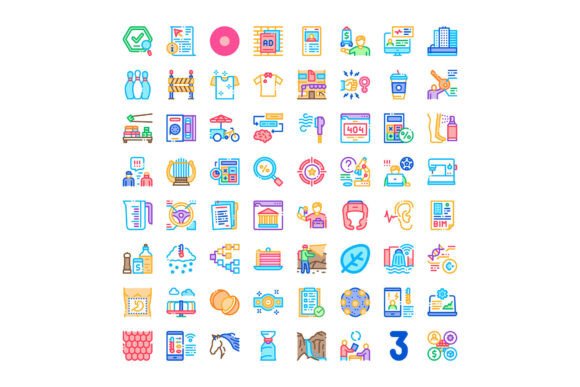
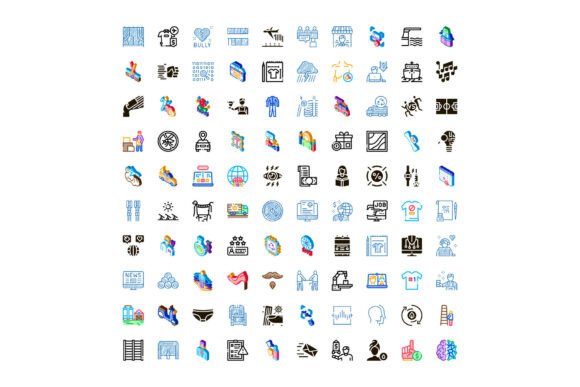
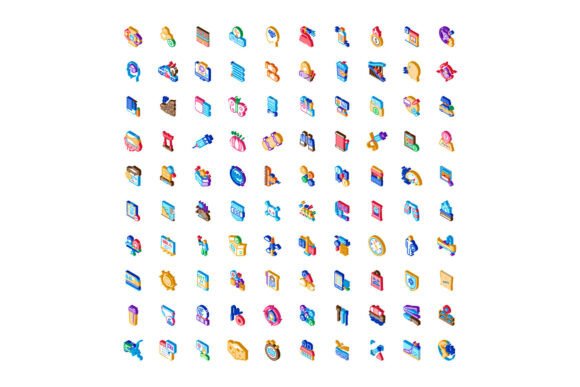
Imagine building a presentation, designing an online course, or launching a startup website—and having a set of clean, colorful, 3D-style icons that instantly communicate ideas like “data analysis,” “online learning,” or “team collaboration.” That’s the core value of Business, Education & Technology Isom: a cohesive collection of isometric icons spanning business, education, technology, health, and finance—designed to make digital visuals clearer, more engaging, and professionally consistent.
What It Really Is (and Why It Feels Intuitive)
“Isom” is short for isometric—a design style where objects are drawn at a fixed 30-degree angle to create the illusion of depth without perspective distortion. Unlike flat or line icons, isometric icons feel dimensional, friendly, and modern. The Business, Education & Technology Isom collection brings this style to life across five key domains. You’ll find icons for cloud servers and coding tools next to graduation caps and lesson plans—and alongside balance sheets, heart monitors, and growth charts—all sharing the same visual language: consistent lighting, harmonious colors, and balanced proportions.
This consistency is what makes it especially useful. When every icon in your slide deck or dashboard follows the same isometric rules, your audience absorbs information faster. There’s no visual whiplash from switching between styles—and no need to hunt for matching assets across ten different sources.
Who Benefits—and How
Freelancers crafting client proposals use these icons to illustrate workflow steps without relying on stock photos. Educators building LMS modules add intuitive visuals to explain complex topics—like using an isometric “circuit board + book” combo to represent tech-integrated learning. Small business owners update their websites with custom infographics showing service offerings, while marketers build social media carousels that highlight customer journeys, budget cycles, or learning pathways.
Even beginners find value quickly. A blogger writing about remote work might drop in an isometric home office scene. A nonprofit team mapping community health programs can pair icons for clinics, data dashboards, and training workshops—all from the same set—to maintain clarity and brand cohesion.
Real-World Uses You Can Start Today
- Presentation decks: Replace bullet points with isometric icons for “strategy,” “feedback loop,” or “student engagement”—making slides easier to scan and remember.
- Digital courses: Use icons to label module types (e.g., “live demo,” “quiz,” “downloadable resource”) so learners know what to expect at a glance.
- Startup landing pages: Illustrate features like “AI-powered analytics” or “real-time collaboration” with expressive, on-brand visuals—not generic clip art.
- Internal documentation: Clarify SOPs, onboarding checklists, or compliance workflows with visual cues that transcend language barriers.
Why Color and Clarity Matter More Than You Think
The collection uses a thoughtfully limited palette—vibrant but not overwhelming, accessible for color-blind users, and optimized for both light and dark mode interfaces. Each icon stands out individually, yet groups together seamlessly. That’s intentional: good isometric design balances detail with simplicity. Too much texture or shading distracts; too little feels flat and forgettable. These icons land right in the middle—detailed enough to be meaningful, clean enough to scale down to 24px without losing legibility.
And because they’re delivered in vector format (SVG and EPS), you can resize them infinitely, recolor them to match your brand, or layer them into interactive prototypes—no pixelation, no licensing surprises.
Things to Keep in Mind Before You Dive In
First, consider your audience’s expectations. While isometric icons feel fresh and approachable, highly formal industries (e.g., certain legal or financial reports) may still lean toward minimalist line icons or traditional illustrations. Match the tone of your project—not just the trend.
Second, think about integration. Most tools—Figma, Adobe XD, PowerPoint, Canva—support SVG imports, but if you’re working in older software or need raster versions (PNG), check whether the collection includes multiple export options. Some sets offer shadows or subtle gradients that look great on screen but require minor tweaks for print.
Third, don’t overlook context. An isometric “graph” icon works well beside a headline like “Performance Trends,” but alone, it could mean sales, grades, or patient vitals. Pair icons with concise labels—especially in multilingual or cross-functional settings—so meaning stays clear.
A Note on Versatility Across Domains
What makes this collection stand out isn’t just its range—it’s how naturally the icons cross categories. A single “network nodes” icon might represent a tech infrastructure diagram, a classroom peer-learning circle, or a small business supply chain. That flexibility saves time and encourages creative reuse. Educators repurpose finance icons to teach budgeting simulations. Health startups adapt business process icons to map patient intake flows. The visual grammar stays familiar, even as the application shifts.
You don’t need design experience to benefit. Many users start by simply replacing default PowerPoint icons—or dragging a few into a Notion dashboard to tag priorities. Over time, they notice patterns: how grouping three related icons creates instant visual hierarchy, or how swapping one icon’s color changes emphasis without changing meaning.
Getting Started Is Simpler Than It Seems
If you’re new to isometric assets, begin small. Pick one recurring need—say, illustrating weekly team goals—and try three different icons from the collection. See which one communicates fastest. Test them in your actual tool, not just a preview. Notice how spacing, sizing, and background contrast affect readability.
As you grow more comfortable, explore combinations: layer a “cloud server” over a “graduation cap” to signal e-learning platforms, or place a “heartbeat line” beside a “growth chart” to visualize health metrics. The best uses often emerge from real tasks—not theoretical ideals.
Ultimately, Business, Education & Technology Isom isn’t about decoration. It’s about reducing friction between idea and understanding. Whether you’re explaining a new SaaS feature to investors, guiding students through a coding exercise, or mapping out your first freelance service package—clear, consistent, colorful visuals help people get it—faster.